

Out of an initial 2033 results retrieved from the database search, the final review included 27 papers22,23,24,25,26,27,28,29,30,31,32,33,34,35,36,37,38,39,40,41,42,43,44,45,46,47,48. Figure 1 presents the PRISMA flow diagram.

The PRISMA (Preferred Reporting Items for Systematic Reviews and Meta-Analyses) flow diagram outlines the study selection process. The numbers show the studies selected or excluded at each step of the study selection.
Characteristics of the included studies
Figures 2 and 3 present the characteristics of the included studies, with specific details presented in Supplementary Data 1.

A Distribution of studies by country. Each country has a unique colour, which corresponds with the colour of the studies. Brown colour represents multi-country studies. B Distribution of studies by type of prevention and year of publication. Blue colour represents primordial prevention; red for primary prevention; yellow for secondary prevention and green are studies that modelled interventions targeting both primary and secondary prevention. C Distribution of studies by type of intervention and level of prevention. The colour codes represent the different types of interventions-black represents diet interventions, yellow for implementation science interventions, blue for studies modelling multiple interventions, green for pharmacological interventions and yellow for interventions targeting tobacco control.

A A graph characterizing the level of prevention by country. Each colour uniquely represents a level of prevention. B A graph presenting the type of intervention by country. Each colour represents an intervention.
Figure 2A presents the distribution of the studies by country. South Africa had the highest number (seven) studies24,30,32,33,36,37,48 followed by Tanzania with four studies38,39,40,43 while Nigeria had three28,36,44. Cameroon22,23, Ethiopia27,47, Ghana29,42 and Kenya34,46 had two studies each, while Uganda had one study45. In five studies, several LMICs were grouped together, and the impact of interventions or policies evaluated at regional or multicountry level25,26,31,35,41. All the studies were published after 2005, with the majority (20/27) being published after 2015 (Fig. 2B).
Types of interventions evaluated
Regarding the level of CVD prevention, 13 studies22,23,27,28,29,30,32,33,34,37,38,39,40,42,44,45,46,48 evaluated interventions targeting primary prevention, five studies22,23,37,40,48 evaluated interventions targeting primordial CVD prevention while eight studies focused on multiple interventions targeting both primary and secondary prevention24,25,26,31,35,41,43,47. One study36 focused on secondary CVD prevention only (Fig. 2C).
Pharmacological interventions (mainly antihypertensives and statins) were the most evaluated either as single24,25,26,27,28,29,30,31,35,36,38,39,41,43,46,47 or combined interventions34,42,44,45. Six studies32,33,34,42,44,45 evaluated implementation science interventions for hypertension screening and treatment. Diet interventions were evaluated in four studies22,23,37,48 while only one study in Tanzania40 evaluated interventions targeting tobacco control. Figure 3A and B present the distribution of the evaluated interventions by country.
Characteristics of the decision analytic models
Figure 4, 5, and Supplementary Data 1 present the characteristics of the DAMs.
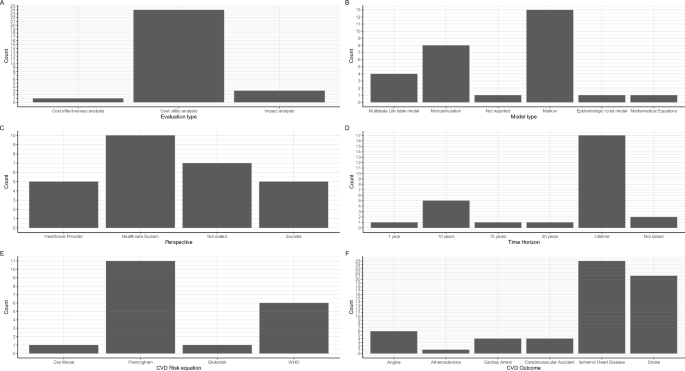
A A graph presenting the type of evaluation performed. B A graph showing the type of model used. C A graph presenting the study perspective adopted. D A graph presenting the time horizon adopted. E A graph showing the cardiovascular disease (CVD) risk equation used. WHO stands for World Health Organization. F A graph presenting the CVD outcomes modelled.

A A graph presenting the distribution of model types by country. Each colour is unique to a model type. B A graph showing the model type by the level of prevention modelled. Each colour is unique to a model type. C A graph presenting the model type by intervention modelled. Each colour is unique to a model type.
Types of evaluations and models
All but three studies22,39,48 were full economic evaluations involving the comparison of costs and health outcomes of which the majority (23/27) were cost-utility analyses23,24,25,26,27,28,29,30,31,32,33,34,36,37,38,40,41,42,43,44,45,46,47 (Fig. 4A). Thirteen studies were Markov models27,28,29,30,31,32,38,39,40,41,42,43,44 whereas seven were microsimulation models24,25,33,34,35,36,46. Markov modelling approach was used by studies evaluating the cost-effectiveness of providing antihypertensive treatment27,28,29,30,31,38,39,43, multicomponent community-based hypertension interventions42,44, community health worker interventions32 and tobacco policies40. Microsimulation models were used to evaluate the impact of pharmacological interventions24,25,35,36,46, and multicomponent interventions involving both screening and treatment33,34. Three studies used multistate life tables to evaluate the impact of sugar taxation37 and salt reduction policies22,23. The WHO-CHOICE methods were used in three studies to model the impact of multiple interventions26,41,47 while one study did not specify the model type but reported using an epidemiologic-cost model45 (Fig. 4B). In South Africa, four different model types were used while most countries had only one model type (Fig. 5).
Study perspectives
Healthcare system perspective of analysis was the most used23,24,26,29,34,36,37,40,43,46 followed by provider28,35,44,45,47 and societal perspectives27,31,38,39,42. Six studies did not explicitly state the perspective of evaluation25,30,32,33,41,48, while the perspective was not relevant in one study that focused on health outcomes only22(Fig. 4C).
Time horizon, cycle length and discounting
The starting age of patients included in 20 models ranged from 15–45 years24,25,27,28,29,30,31,32,33,35,36,37,38,39,40,41,42,43,44,45,46. Three studies22,23,48 modelled whole populations while the starting age of patients was not clear in two studies26,34,47. Lifetime horizon was adopted by 17 studies22,23,24,26,27,29,31,36,37,38,39,40,41,43,44,46,47 while eight studies adopted 10–30 year horizons23,25,28,30,34,35,42,45. In one study48, the analyses were performed over one year whereas the horizon was not stated nor clear in two studies32,33(Fig. 4D). Annual cycle lengths were the most adopted in 19 studies22,23,24,25,27,28,29,30,32,33,34,36,38,39,40,42,43,44,46 while the remaining eight studies did not specify their cycle length26,31,35,37,41,45,47,48. None of the studies mentioned performing half-cycle correction. Three percent discount rate was used in all the 22 studies22,23,24,25,26,27,28,29,30,31,33,34,36,38,40,41,42,43,44,45,46,47 where discounting was performed.
CVD outcomes modelled
Figure 4F presents the CVD outcomes included in the DAMs. The sum of complications from the graph exceeds the number of studies because all but two studies26,37 modelled multiple CVD outcomes as health states. Fifteen studies modelled two CVD states24,27,28,31,35,36,38,39,40,41,42,43,44,45,47, six studies modelled four CVD states22,23,30,34,46,48, four studies modelled three states25,29,32,33, while one study modelled only one CVD state37. Atherosclerotic CVDs were the commonest health states modelled in all DAMs that specified outcomes, while only six studies22,23,24,25,29,48 included hypertension complications as health states.
Ischaemic/coronary heart disease and/or stroke were the most common CVD outcomes in all studies except one study26, which reported CVD as an outcome but did not specify type of CVD (Fig. 4F). Twenty three studies22,23,24,25,27,28,29,31,32,34,36,37,38,39,40,41,42,43,44,45,46,47,48 modelled stroke as an outcome while three studies30,31,35 included cerebrovascular accidents (CVA). Angina and cardiac arrest were modelled in seven27,30,31,32,33,34,46 and five27,30,33,34,46 studies, respectively. Two studies modelled ischaemic and haemorrhagic stroke as separate outcomes22,23 and also separated hypertensive from ischaemic heart diseases.
CVD risk equations
Framingham risk equations were the most used to compute 10-year CVD risk in 11 studies23,27,28,30,31,32,34,38,43,44,46 (Fig. 4F). Four studies used the World Health Organization (WHO) absolute risk-based approach for computing the 10-year CVD risk24,25,39,47. Pozo-Martin et al.42 used the Framingham risk equation for the base case but performed sensitivity using the WHO CVD risk charts for Western sub-Saharan Africa. Basu et al.24 used both WHO/International Society of Hypertension (ISH) risk equations and Harvard/National Health and Nutrition Examination Survey (NHANES) to compute CVD risk for patients treated using different guidelines24. Gaziano et al.33 fitted two cox proportional hazards models using the US NHANES 1 dataset to predict the risk for IHD and CVA. In their cost-epidemiologic model, Sando et al.45 used the Globorisk equations to compute 10-year CVD risk among HIV patients in Uganda.
Health outcomes and Equity considerations
Supplementary Data 1 presents the outcome measures included in the models. Majority (18/27) of the studies used disability adjusted life years (DALYs) as the generic measure of the health outcomes24,25,26,27,29,32,34,36,37,38,40,41,42,43,44,45,46,47. Four studies used the quality adjusted life years (QALYs)28,30,31,33 while two studies used the health adjusted life years outcome measures22,23. Lim et al35. reported deaths averted only. Five studies reported either CVD events or deaths averted alongside a generic measure of health outcome23,25,34,36,45. Robberstad et al.43 used the life years gained as a surrogate outcome. Seven studies performed different types of equity analyses22,24,34,37,39,45,48. Subgroup analysis was used in five studies22,24,34,37,45, while one study each used extended cost effectiveness analysis (ECEA)48 and distributional cost effectiveness analysis (DCEA)39 methodologies. Gender inequalities were the most assessed in four studies that explored the difference in health outcomes between males and females22,24,37,45. Three studies24,39,48 assessed the impact of interventions across different socioeconomic groups. Ngalesoni et al.39 used life expectancy, Gini coefficient, and achievement index as measures of equity impact of primary CVD prevention. Similarly, Watkins et al.48 used deaths averted, catastrophic health expenditure averted, and poverty cases averted to measure the equity impact of salt reduction policies in South Africa. Only one study each focused on ethnic24 and regional inequalities34.
Uncertainty and budget impact analyses
Eighteen studies22,23,27,29,30,31,32,34,36,37,38,40,41,42,43,44,47 performed both one-way and probabilistic sensitivity analyses (PSA) whereas seven studies24,26,33,35,45,46,48 performed only one-way sensitivity analyses. One study performed PSA only28 while two studies25,39 did not report performing any sensitivity analyses. Seven studies28,29,34,38,43,44,47 presented cost-effectiveness acceptability curves (CEAC) or frontiers (CEAFs) showing the relative probability of cost-effectiveness of alternative interventions. Only two studies performed value-of-information (VOI) analysis28,38. Similarly, only five studies conducted budget impact analyses for the evaluated interventions24,29,34,36,37.
Model adaptation and validation
Five studies adapted previously developed models in international settings to suit their decision problems27,29,32,33,47. The CVD policy model, a validated model previously developed for the US population, was adapted to the Ethiopian27 and South African33 settings. In Ghana, one study adapted a 2006 model initially used by the UK NICE to update the hypertension guidelines29. Another study47 adapted the WHO CHOICE model for East Africa to suit the Ethiopian setting. Only three studies reported conducting some form of model validation27,30,33. However, the details of the validation were not adequately reported to establish the types of validation performed or the process undertaken. Model calibration was reported in two studies30,36 while four studies provided details of stakeholder elicitation processes to obtain expert opinion23,29,42,45.
Quality assessment based on Philips checklist
Supplementary Data 1 presents the quality appraisal of the included models against the different dimensions of the Philips et al.17 checklist. The mean quality score of the papers based on the Philips checklist was 68.9% and ranged from 46.4% to 85.1% (median = 72.3%). Fifteen studies scored above 70%, while only two studies scored below 50%. Based on the models’ dimensions of quality: the structure dimension scored the highest (84.9%), data dimension averaged 58.0% while the consistency dimension scored the least at 45.8%.
In all the studies, the decision problems were clearly defined and were consistent with the objectives of the evaluations and models specified. However, only 15 studies specified the primary decision maker22,23,24,29,30,32,37,38,39,40,42,44,46,47,48. Fourteen studies did not include all the feasible options in the evaluations27,28,29,33,34,36,40,42,43,44,45,46,47,48. The disease states included in almost all the studies reflected the underlying pathophysiology of the disease. Six studies did not define or justify the cycle length26,37,41,42,45,47.
The data used to construct most models (22/27) were aligned with the objectives of the evaluations. Regarding cost data, 17 studies reported using local sources either from administrative sources or from primary data collection23,24,27,28,29,34,37,38,39,40,42,43,44,45,46,47,48. However, none of the studies assessed the quality of the data used. Almost half of the studies (12/27) did not justify the choices made between different data sources26,28,30,31,32,33,39,40,41,42,43,46. The majority of the studies did not report the processes used to elicit expert opinion (21/27). None of the studies performed all the four principal types of uncertainty analyses (methodological, structural, heterogeneity, and parameter). Parameter uncertainty was the most assessed through sensitivity analyses while structural uncertainty was the least addressed.
Nine studies reported performing tests of the mathematical logic of the model before use. However, only two studies30,36 reported performing model calibration against independent data, but the details were very scanty. The majority of the studies (21/27) compared their results with those of previous models.
link