

Participants and study design
This study used data from UK Biobank, which is an ongoing prospective cohort study of over half a million participants aged 40–69 years at recruitment (5.5% response rate out of around 9,000,000 eligible individuals)15. The study protocol of the UK Biobank, detailed in eText 1, was approved by the North West Multicentre Research Ethics Committee (11/NW/0382). The conduct of the present study was approved by the Institutional Review Board of The University of Hong Kong / Hospital Authority Hong Kong West Cluster (UW 21–542). All measurements and experiments were performed in accordance with relevant guidelines and regulations, and all participants provided written informed consent prior to participation15.
The present study included 291,151 individuals who met the following inclusion criteria: (1) having self-reported as European descendants (‘white British’) with verification by principal component analysis of genetic ancestry, (2) having consistent self-reported and inferred gender information, (3) having no prevalence of cardiovascular events at baseline (i.e., CHD and stroke; based on hospital admission, deaths registries and self-report data), and (4) having no missing values for any predictors and PRS (eFigure 1).
Polygenic risk score (PRS)
In the UK Biobank study, genotyping of all participants was carried out with the UK Biobank Axiom Array and UK BiLEVE Axiom Array, with imputation to a haplotype reference panel of the Haplotype Reference Consortium combined with UK10K16. Specifically, the calculation of weighted PRS was based on 300 Single-Nucleotide Polymorphisms (SNPs) known to be associated with the risk of CHD, consisting of genome-wide significant and non-significant SNPs uncorrelated with each other at a false discovery rate of 5% (eTable 1), as applied in a previous study by Ntalla et al.3 Weighted PRS for CHD risk was then derived by summing the products of the number of risk-increasing alleles at each of the loci and the corresponding effect size identified from the literature2,3.
Derivation of the Lifestyle-Based Model (LBM)
The LBM was developed using the following variables as predictors, based on the established associations with the risk of CHD:4 age, sex, body mass index (BMI), dietary intake score (0–3; generated based on self-reported food categories), smoking status (current, previous, never), and physical activity (wrist-worn wearable-device-derived Euclidean Norm Minus One; ENMO, a composite value of 3 axes’ acceleration values).
Information on diet and smoking status was collected through the self-reported touch-screen questionnaire. A dietary intake score (ranging from 0 to 3) was constructed based on the guidelines from the AHA,17 following an established procedure18. Both calibrated ENMO and raw ENMO were used as indicators of physical activity. Information on the generation of dietary intake scores and physical activity variables can be found in eText 2 and eText 317,18.
Pooled Cohort Equations (PCE) and Systematic COronary Risk Evaluation 2 (SCORE2)
Following the recommended procedures,12,19 we recalibrated the PCE and SCORE2 in order to match the PCE and SCORE2 predictors to the variables of the UK Biobank database incorporating information on age, sex, smoking status (yes or no), total and high-density lipoprotein cholesterol (mmol/l), blood pressure (mmHg; treated with medications or untreated), and diabetes (yes or no). We re-estimated the rescaling weights obtained from regressing the predicted risk against observed risk using the original PCE published in 2013 and SCORE2 formula for low risk region (the United Kingdom)10. Detailed information on the definition and quantification of PCE and SCORE2 risk predictors is provided in eTable 2.
Incidence of CHD
CHD incidence was ascertained through the linkage of UK Biobank participants’ measured data with their hospital admission records and death registry15. Codes of International Classification of Diseases (ICD) and operative procedures were used to classify CHD events (ICD-9: 410, 411,412.X, ICD-10: I21, I22, I23, I24, I25.2, OPCS: K40 – K46, K49, K50.1, K50.2, K50.4). Incident CHD was defined as the first observation of CHD events that occurred until 9th December 2022 for individuals in England and Wales and 19th December 2022 for individuals in Scotland.
Statistical analyses
The full data sample was randomly split into 5 sub-groups with an approximately equal number of individuals allocated per group (See Fig. 1) for model development and cross-validation of LBM and LBM + PRS. To develop the LBM, we fit Cox proportional hazard models incorporating age, sex, BMI, dietary intake score, smoking status, and physical activity. Following the established methodology for PCE model development,10 interactions of age with each lifestyle-based predictor were tested, and retained as predictors in the model if the p-value was less than 0.01; or the p-value was between 0.01 and 0.05, with a continuous net reclassification improvement (NRI) for non-events ≥ 15% or a statistically significant integrated discrimination index (IDI) in the full sample.
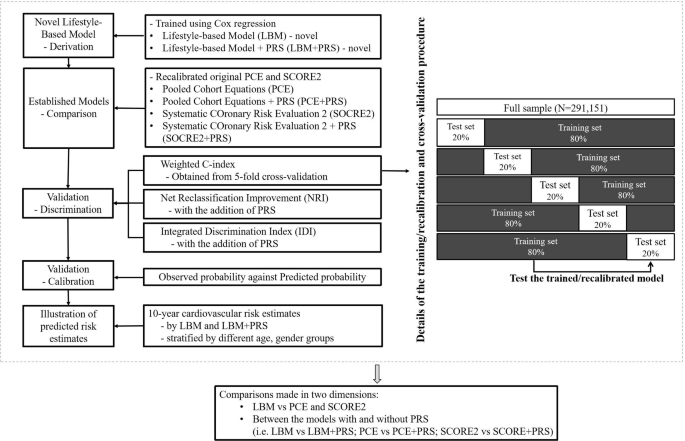
Study design, model derivation, and model validation process. Notes: LBM: using age, sex, body mass index (BMI), dietary intake score, smoking status (current, previous, never), and physical activity (mg). LBM + PRS: adding polygenic risk scores to the LBM. PCE: using age, sex, smoking status (yes or no), total and high-density lipoprotein cholesterol (mmol/l), treated or untreated systolic blood pressure (mmHg), and diabetes (yes or no). PCE + PRS: adding polygenic risk scores to the PCE. SCORE2: using age, sex, smoking status (yes or no), total and high-density lipoprotein cholesterol (mmol/l), systolic blood pressure (mmHg), and diabetes (yes or no). SCORE2 + PRS: adding polygenic risk scores to the SCORE2. Abbreviations: CHD = coronary heart disease; CI = confidence interval; IDI = Integrated Discrimination Index; LBM = Lifestyle-Based Model; LBM + PRS = Lifestyle-Based Model plus polygenic risk score; NRI = Net Reclassification Improvement; PCE = Pooled Cohort Equations; PCE + PRS = Pooled Cohort Equations plus polygenic risk score; PRS = polygenic risk score; SCORE2 = Systematic COronary Risk Evaluation 2; SCORE2 + PRS = Systematic COronary Risk Evaluation 2 plus polygenic risk score.
For cross-validation of prediction models (LBM, PCE, SCORE2, LBM+PRS, PCE+PRS and SCORE+PRS), a total of 5 iterations of training/cross-validation were performed, with each 20% sub-group used as a cross-validation set and the remaining 80% subset (i.e., four 20% sub-groups) as a training set in each iteration20. Cox regression was fit to estimate the C-index (ranging from 0.5 for no discrimination to 1.0 for perfect discrimination, on average) along with 95% confidence interval (CI) values for each model across the 5 iterations21 We then weighted each of the 5 C-index values relative to the corresponding number of CHD incidence cases to obtain the weighted average C-index. A paired t-test was performed to evaluate the changes in the C-index between the prediction models with and without the inclusion of the PRS.
To further examine the added value of PRS to the LBM and established algorithms, we evaluated the risk reclassification ability by calculating the continuous NRI (calculated as the sum of “NRI+” [event NRI] and “NRI-” [non-event NRI]), categorical NRI (according to the threshold of 7.5% for LBM and PCE and 10% for SCORE2), and IDI (calculated based on the sum of the integrated sensitivity and integrated specificity, indicative of improvements in the slopes of the discrimination curves) as additional parameters of discrimination22.
To examine the calibration of the LBM and established prediction models, calibration plots were created by plotting the mean observed Kaplan-Meier estimates (observed probability) against the mean predicted probability within each decile of the predicted probabilities from each model. We also calculated the corresponding calibration slopes (with a “slope value = 1” indicating perfect calibration, on average), and Greenwood-Nam-D’Agostino (GND) P-values23.
To demonstrate how incidence CHD rates vary by 10-year absolute CHD risk estimates predicted by the six models (LBM, PCE, SCORE2, LBM + PRS, PCE+ PRS and SCORE2 + PRS), we estimated cumulative CHD incidence rates for four risk reclassification groups defined according to 10-year CHD risk estimates, applying the cut-off point of 7.5% for PCE and LBM; and 10% for SCORE2.
A total of 3 sets of sensitivity analyses were performed with details provided in eText 4. Statistical analyses were performed using Stata/MP Version 17.0 (StataCorp LP, College Station, TX) and R (Version 4.4.3).
link