

Descriptive analysis
A total of 180 elderly stroke patients participated in this study. Key demographic information such as age distribution, gender, comorbidities, and physical activity levels are presented. Notably, the majority of patients had hypertension, with a significant number reporting low physical activity levels. Descriptive statistics for all variables are summarized in Table 2.The age distribution of elderly stroke patients was as follows: 45 participants (25%) aged 65–69 years, 54 participants (30%) aged 70–74 years, 46 participants (25.6%) aged 75–79 years, and 35 participants (19.4%) aged 80–85 years. Regarding gender, the cohort included 96 females (53.3%) and 84 males (46.7%). Comorbidity analysis showed that 40 participants (22.2%) had no comorbidities, 65 participants (36.1%) had one, 55 participants (30.6%) had two, and 20 participants (11.1%) had three or more comorbidities. The most common comorbidities were hypertension (140 participants, 77.8%), diabetes (65 participants, 36.1%), and coronary heart disease (45 participants, 25%).In terms of physical activity, 60 participants (33.3%) reported no regular exercise, 45 participants (25%) exercised 1–2 times per week, 35 participants (19.4%) exercised 3–4 times per week, and 40 participants (22.2%) exercised five or more times weekly.
First, the collected data are pre-processed to ensure that their quality is suitable for analysis. This involved dealing with erroneous values, outlier detection and variable transformation. Of note, persistent changes such as blood pressure were categorized into systolic blood pressure (SBP) and diastolic blood pressure (DBP), while time points were converted into factors for categorical modeling. In addition, data were standardized to a normalized distribution and prepared for subsequent analysis of results. .
Adherence modeling based on time effects
The effect of time on long-term adherence was significant for all four adherence dimensions (A1, A2, A3, A4). Time points showed gradual improvement in adherence, with the largest improvements observed at T3. The effects of physiological and psychological factors, as well as personalized feedback interventions, were also explored.
Set A1, A2, A3, and A4 as dependent variables, respectively, and introduced time as a fixed effect and a random effect (individual differences) into the model. Setting up A1 rehabilitation program completion rate as the dependent variable, the time point was introduced as a fixed effect and random effect to explain the individual differences of patients. Based on the data analysis, the results of modeling A1 are as follows:
$$\text{A}1{\:}_{\text{i}\text{j}}={{\upbeta\:}}_{0}+{{\upbeta\:}}_{1}\times\:{\text{Time\, point}}_{\text{\,i}}+{\text{b}}_{0\text{j}}+{{\upepsilon\:}}_{\text{i}\text{j}}$$
\({\beta _0}\) is a constant term, \({\beta _1}\)is the slope coefficient at the point in time, which indicates the effect of the point in time on the rate of completion of the rehabilitation program, \({b_{0j}}\)is the random intercept term for patient ID, which indicates the deviation of each patient relative to the overall average, and \({\varepsilon _{ij}}\)is the error term. Figure 2 demonstrates the fixed effect sizes of the factors in the A1 model. It can be seen that different factors affect the completion rate of the rehabilitation program to different degrees. The time effect is significant in it, especially in the T2 and T3 stages, which means that the completion rate of patients’ rehabilitation program increases significantly with the passage of time; the effect of T2 and T3 reaches 1.11 and 2.09 respectively, which shows the trend of gradual improvement. Among the personalized feedback intervention variables, D1 and D3 showed some negative effects, albeit not to a strong extent, suggesting that inappropriate feedback frequency and irrelevant feedback content may have a slightly negative effect on the rehabilitation completion rate. D2, on the other hand, showed a small positive effect, suggesting that high-quality feedback contributes to completion rates.The B variable effect was small and barely significant, implying that these physiological factors have a more limited contribution to rehabilitation completion rates. Of the psychological factors, C3 had a slight positive effect, suggesting that positive emotions may have contributed to the completion of the rehabilitation program to some extent, but the effect was weak.

Changes in long-term adherence subvariables with SBP and C1.
The correlations of random effects, fixed effects, and fixed effects are shown in Tables 3, 4 and 5. The tabular data show that for A1, the results indicate that T2 significantly increased the rate of completion of the rehabilitation program compared to T1 at baseline time, by an average of 1.251 units (t = 34.25), whereas T3 showed an even greater increase, by 2.284 units (t = 62.56). For example, the 2.28-unit increase in rehabilitation program completion rate (A1) at T3 indicates that patients completed, on average, 22.8% more of their prescribed activities compared to baseline. This improvement reflects enhanced adherence over time, potentially translating to better functional recovery. Similarly, a 2.30-point rise in self-reported adherence (A2) at T3 suggests sustained patient engagement, while the 2.11-unit reduction in interruptions (A4) highlights fewer lapses in continuity of care.
The random intercept variance for patients was 0.0068 and the standard deviation was 0.0825, which suggests that fluctuations in the rate of completion of the rehabilitation program were small between patients and that individual differences had a limited impact on the overall trend. In addition, the correlation with the intercept for both T2 and T3 was − 0.688, implying that the improvement at subsequent time points may be slightly smaller in patients with higher baseline levels. In terms of A2, self-reported adherence scores increased by 1.123 points from baseline in T2 (t = 31.39), while T3 increased further to 2.3 points (t = 64.27), demonstrating the significant role of the time effect in enhancing adherence. The randomized intercept variance between patients was 0.0011 with a standard deviation of 0.0335, further demonstrating the small differences in baseline scores.The correlation between T2 and T3 and the intercept was − 0.704 for both, suggesting that patients with higher baseline adherence showed relatively little improvement at subsequent time points. For A3, the estimate at T2 was 1.368 (t = 50.34) and increased further to 2.344 (t = 86.26) at T3, reflecting the significant boosting effect of the time effect on completion of specific rehabilitation activities. The variance of the random intercept for patients was 0.0075 with a standard deviation of 0.0868, suggesting that inter-individual differences in baseline completion were small, and the correlation between T2 and T3 and the intercept was 0.670 for both T2 and T3, which also suggests that patients with higher baseline completion had a relatively small increase in subsequent time points. For A4, T2 significantly reduced the number of interruptions by a mean of 0.887 (t = -17.31), whereas T3 reduced the number of interruptions by 2.109 (t = -41.17), showing a trend toward significantly less interruptive behavior over time. The variance of the randomized intercept for patients was 0.0155 with a standard deviation of 0.1246, suggesting smaller differences in the number of baseline interruptions between patients.This finding was supported by the negative correlation between T2 and T3 and the intercept (-0.685), suggesting that patients with higher baseline interruptions experienced a greater reduction at subsequent time points.
In summary, the time effect demonstrated a significant impact on all four adherence indicators, showing a positive effect of the intervention over time. Although there were some individual differences between patients, the effects were small and the overall trend was more consistent across the sample. In addition, the negative correlation between time point and intercept suggests that patients with higher baseline levels may have relatively smaller gains or decreases at subsequent time points.
Long-term adherence main effect
The analysis of the main effect of time on long-term adherence showed significant improvements in all four adherence dimensions (A1, A2, A3, A4) over time, particularly during T3. Notably, physiological variables did not exhibit significant effects on adherence, whereas psychological factors, such as positive mood, played a more prominent role. Feedback quality (D2) also had a substantial positive impact on adherence, while inappropriate feedback frequency (D1) was associated with a slight negative effect.
In Model 2, the four main adherence dimensions were systematically assessed by progressively introducing B, C, and D. The four dimensions of adherence were assessed in the model. Among these four dimensions, the time effect showed a significant impact, especially on A1 and A3, where patient adherence significantly increased over time.
In the A1 model, the effect of T2 on A1 was 1.0191 (t = 9.52, P < 2e-16), whereas the effect of T3 was 1.9038 (t = 10.92, P < 2e-16), showing that patients’ completion of the rehabilitation program continued to increase over time, and the improvement was particularly significant at T3. With the addition of the B variable, physiological monitoring factors such as B1, SBP, DBP, B3, and B4 did not show a significant effect on A1, indicating that these physiological factors did not play a significant role in this process. Among the psychological factors, C3 had a significant positive effect on A1 with an effect of 0.1572 (t = 2.695, P = 0.00727), whereas the effects of other psychological factors such as C1, C2, and C4 were weaker and did not show a significant effect. With the addition of the D variable, the effect of D1 was − 0.0914 (t= -1.93, P = 0.05433), which was close to being significant, showing that inappropriate feedback frequency may negatively affect the completion of the rehabilitation program, while D2 had a significant positive effect on the completion rate of the rehabilitation program, with an effect of 0.0318 (t = 2.08, P = 0.03814), which further validated the effective importance of feedback.
In the A2 model, the time effects were also significant. the effect of T2 was 1.114 (t = 25.751, P < 2e-16) and the effect of T3 was 2.279 (t = 36.045, P < 2e-16), showing a significant improvement in A2 over time. Among the physiological variables, the effect of B1 on A2 was 0.0212 (t = 1.436, P = 0.1517) non-significant; the effect of SBP was close to significant (P = 0.0722), and the other physiological factors (e.g., DBP, B4, etc.) did not show a significant effect on A2.The effect of time remained significant after the addition of the C variable, with T2 of 1.334 (t = 12.940, P < 2e -16), and T3 was 2.650 (t = 15.802, P < 2e-16). the C variables all had small effects on A2, with C2 approaching significance (P = 0.1204). With the addition of D, the time effects remained significant, with T2 at 1.234 (t = 10.887, P < 2e-16) and T3 at 2.452 (t = 12.570, P < 2e-16). However, the effect of D2 was − 0.0371 (t = -2.510, P = 0.0124), indicating that ineffective feedback may reduce adherence, suggesting that the quality of feedback is more critical than the frequency and relevance of feedback.
In the A3 model, the time effect continued to show a significant positive effect, with an effect of 1.336 (t = 40.345, P < 2e-16) for T2 and 2.280 (t = 46.284, P < 2e-16) for T3, indicating a significant increase in A3 over time.B did not show a significant effect on A3.The effect of C2 (P = 0.1204) was nearly significant, while the other C variables did not significantly affect rehabilitation activity completion. The time effect remained significant with the addition of D, with a T2 of 1.420 (t = 15.809, P < 2e-16) and a T3 of 2.419 (t = 15.600, P < 2e-16). However, the effects of D1 and D2 were not significant, suggesting a smaller effect on A3 completion.
In the A4 model, the time effect continued to show a significant negative effect with a T2 of -0.9325 (t = -14.932, P < 2e-16) and a T3 of -2.2065 (t = -23.922, P < 2e-16), indicating a significant decrease in patients’ A4 over time.The B variables did not show a significant effect on A4.Of the C variables, C1 had a significant negative effect (P = 0.0181), suggesting that patients with higher levels of depression may be less likely to exhibit interruptive behavior. The feedback variable had a smaller effect and did not show significance.
Taken together, the time effect was significant in all adherence dimensions, especially in the completion rate of the rehabilitation program and the completion of specific rehabilitation activities, showing a significant increase in adherence over time; the effects of the physiological variables were generally not significant, suggesting that these indicators have a limited role in long-term adherence; among the psychological variables, positive mood contributed to the increase in the completion rate of the rehabilitation program, whereas depressed mood decreased the number of interruptions, suggesting the the importance of mental health support; feedback effectiveness showed a significant effect in rehabilitation program completion rates and self-reported adherence, suggesting that high-quality feedback helps maintain adherence, while inappropriate feedback frequency may have a negative impact.
Physiological and psychological monitoring interaction effects
The interaction effects between physiological and psychological monitoring factors were explored, but no significant synergistic effects were observed. The findings suggest that the independent effects of physiological and psychological factors are more pronounced in rehabilitation adherence, and more complex mechanisms may be at play.
In terms of psychological monitoring, the results of the study showed that the unique influence of patients’ C3 and C1 in adherence cannot be ignored. In particular, in the A1 model, C3 had a significant positive effect on A1 with an estimated value of 0.1581 (P = 0.0151), which suggests that a positive psychological state 000011 and promotes the rehabilitation process. Positive emotions can increase patients’ sense of commitment and motivation to the rehabilitation task and enhance their willingness to adhere to the rehabilitation program. In the A4 model, C1 showed a significant negative effect on the number of interruptions and re-engagements (estimate − 0.0885, P = 0.0199), suggesting that higher levels of depression may reduce patients’ willingness to re-engage in rehabilitation.
In addition, D had a significant effect on the quality and relevance of the A In the A1 model, the effect of D2 on A1 was significantly positive with an estimated value of 0.0316 (P = 0.0402), suggesting that high-quality, personalized feedback is effective in helping patients to understand the rehabilitation tasks and providing incentives to be more proactive in participating in the rehabilitation program. D3, however, showed a significant negative effect with an estimated value of -0.0385 (P = 0.0121), suggesting that feedback content that is not relevant to the patient’s actual rehabilitation status may negatively affect adherence and weaken the patient’s confidence in the rehabilitation program. Similarly, D2 showed a significant negative effect in the A2 model (estimate − 0.036, P = 0.0149), suggesting that in some cases, ineffective or useless feedback, rather than motivating patients, may play a negative role.
To further explore the synergistic effects between the B and C factors, several physiological and psychological interaction terms (e.g., SBP × C1, B1 × C2, B3 × C3) were included in Model 3. However, from the model results, none of these interaction terms showed significant effects across the adherence dimensions, suggesting that the synergistic effects between physiological and psychological factors are not significant in rehabilitation adherence, or their effects on adherence may be relatively independent. This suggests that perhaps there are more complex mechanisms for the interaction of physiological and psychological factors that are difficult to capture through a simple interaction model. No significant synergistic effects were observed between physiological (B) and psychological (C) factors, suggesting their impacts on adherence are independent. Therefore, future studies may consider using more detailed physiological and psychological measures to explore possible subtle interaction effects.
In summary, the results of Model 3 provide several key insights for enhancing long-term adherence. First, the role of mental health management in the rehabilitation process cannot be ignored, especially interventions to enhance positive mood and reduce depression are crucial; again, the quality of personalized feedback directly impacts patient adherence, and the feedback should be relevant and effective in order to improve patient understanding and confidence in the rehabilitation program. In addition, the synergistic effect between physiological and psychological factors did not show significance, suggesting that the independent effects of physiological and psychological factors should be considered separately in the design of rehabilitation interventions, rather than simply assuming that there is a significant synergistic gain between the two.
Model diagnostics and hypothesis testing variance inflation factor (VIF)
In this section, multicollinearity among predictor variables was assessed using the Variance Inflation Factor (VIF), and the results showed no significant multicollinearity issues. Additionally, robust mixed-effects models were employed to address potential outliers and non-normal residuals. The residual plots and QQ plots demonstrated that the robust model improved the distribution and homoscedasticity of residuals, enhancing the overall model fit.
In the multicollinearity analysis, the variance inflation factor (VIF) was calculated for each model (A1, A2, A3, A4) to assess the problem of multicollinearity among the predictor variables. Typically, a VIF value of more than 5 to 10 implies a potential multicollinearity problem, which may distort the coefficient estimates and their significance. In our models, most of the predictor variables have VIF values below 5, which suggests that multicollinearity is not a major problem in these models.VIF values for all models were below 5, indicating minimal multicollinearity. Robust mixed-effects models (robustlmm package) were used to mitigate residual heteroskedasticity and non-normality, improving model reliability. Residual plots (Figs. 3 and 4) confirmed improved homoskedasticity and normality in the robust models.However, we also observe that some of the VIF values are close to this threshold, indicating some degree of correlation between the predictor variables. This finding emphasizes the need for caution when interpreting the coefficients, as multicollinearity can lead to inflated standard errors, which can affect the reliability of the results.
We use robust mixed effects models from the robustlmm package.Robust model aims to reduce the effects of outliers and non-normal residuals in order to estimate coefficients more reliably. The formulation of each robust model is consistent with the structure of the original mixed effects model, while ensuring that the predictor variables are appropriately adjusted to enhance the robustness of the model. These Robust models help to reduce the impact of outliers, thereby improving the overall fit of the model to most of the data.
Residual versus fitted value plots were generated for each Robust model to assess the fit and check for homoskedasticity. The distribution of residuals for the Robust model improved compared to the initial model. While some degree of heteroskedasticity still exists, overall the variance of the residuals stabilizes within the range of fitted values, indicating that the Robust model approach successfully mitigated some of the previous problems, as shown in Fig. 3.
Residuals vs. Fitted Values for model validation.
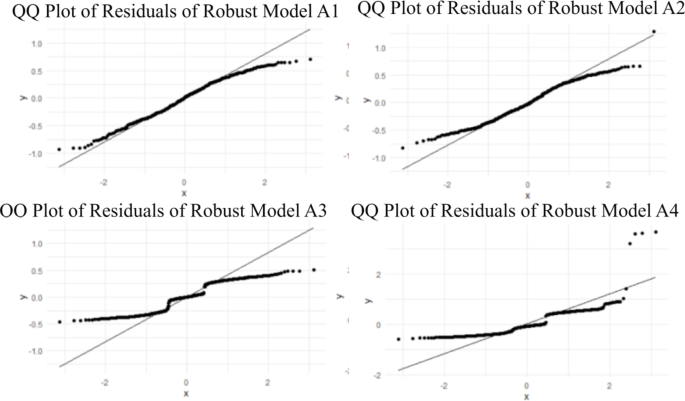
The QQ plot for the Robust model shows an improvement in the normality of the residuals. While there are still some deviations from the diagonal, they are not as significant as in the standard model. This suggests that the Robust model approach may better address the non-normal distribution of the residuals, enhancing the validity of the hypothesis tests associated with the model coefficients, as shown in Fig. 4.The Robust weights show how well the model handles influential data points. Most of the weights close to 1 confirm that most of the observations perform well.

Q-Q Plot of residuals for each model in the robust mixed effects analysis.
link