

Study design
This research presented a methodology for developing a predictive model of disability in the elderly, as depicted in Fig. 1. The process began with integrating the National Health Insurance Research Database (NHIRD) and Long-Term Care Database (LTCD) in Taiwan to form disease predictors and patient demographics for the model. Relevant variables were identified via embedded feature selection techniques. The dataset was divided into an 80% training set and a 20% testing set, with data imbalance adjustments applied to improve prediction accuracy. Model validation employed a 5-fold cross-validation approach. Model performance was evaluated using metrics such as sensitivity, specificity, balanced accuracy, and the average Area Under the Receiver Operating Characteristic Curve (AUC). The most accurate model was selected, and the Shapley Additive Explanation (SHAP) method was employed to pinpoint key disease-related variables, thereby aiding policymakers in crafting efficient intervention strategies.
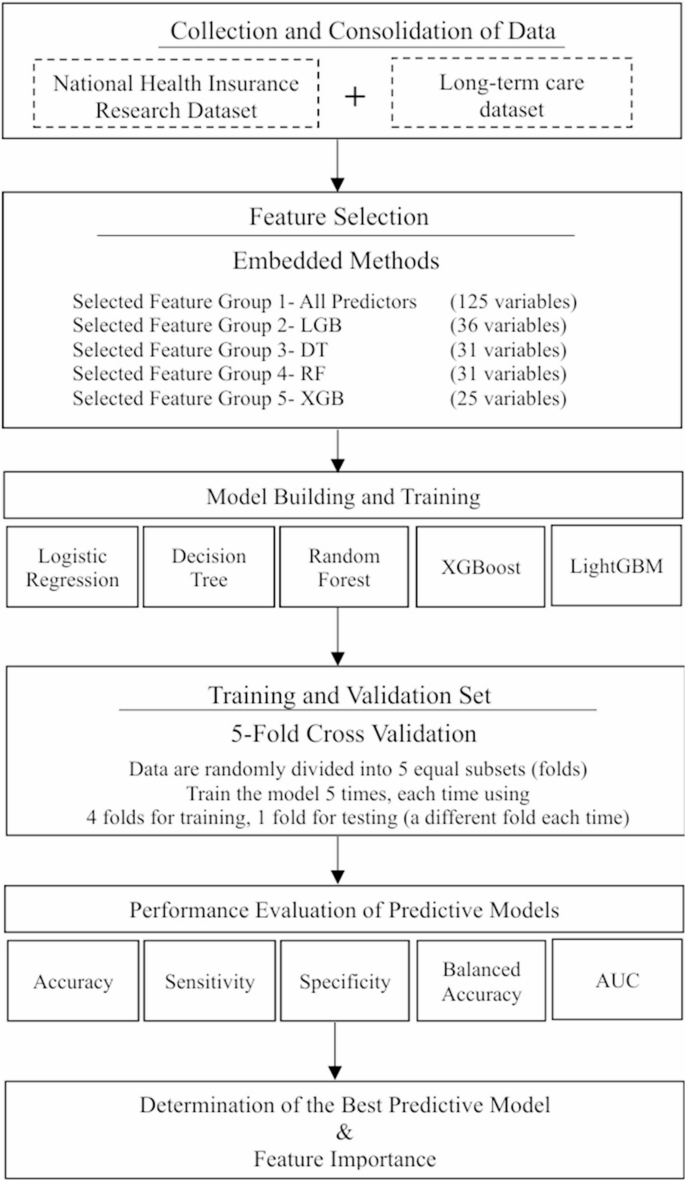
Flow chart of the study design for constructing an elderly disability risk prediction model. The abbreviation LGB stands for Light gradient-boosting machine (LightGBM), DT refers to the Decision Tree Model, RF refers to the Random Forest Model, and XGB stands for eXtreme Gradient Boosting (XGBoost) model
Data
In this research, Taiwan’s National Health Insurance Research Database (NHIRD) and Long-Term Care Database (LTCD) were harnessed to construct a disability risk prediction model for the aging demographic. The LTCD, a vast national repository, encompassed data on long-term care types and levels, disability status, and associated information, facilitating the identification of Taiwan’s disabled population [30]. The NHIRD, a comprehensive nationwide longitudinal database covering 99% of citizens, provided extensive medical claim details, including diagnosis history, medication usage, hospitalization, and surgical records. These data were instrumental in developing an exhaustive set of disease-predictive variables for the aging population.
Study population
This research analyzed a cohort of 3,949,716 individuals aged 65 and above from the NHIRD between 2017 and 2020. Within this group, 433,623 seniors required long-term care due to disabilities, constituting approximately 11% of the study population, while the remaining 3,516,093 were classified as non-disabled.
As detailed in Table 1, the disabled group was generally older, had a higher proportion of females, and exhibited a greater incidence of comorbidities compared to their non-disabled counterparts. These demographic and health distinctions underscored a strong correlation between comorbidities and disability, providing critical parameters for machine learning models to accurately identify disability risks.
Primary outcome measure
The long-term care case-mix system (CMS) was the official standard used by Taiwan’s long-term care authorities to evaluate an individual’s disability status and determine eligibility for service Subsidies. The CMS was a composite scoring system that integrated 11 dimensions, including activities of daily living (ADL), instrumental activities of daily living (IADL), emotional and behavioral problems, mental disorders, communication ability, cognitive functioning, continence, mobility, self-care ability, health-related conditions, and complex medical care needs [31]. Each domain was assessed through a structured evaluation conducted by trained social workers, who scored each item based on the severity of impairment. The aggregated scores generated a CMS level ranging from 0 (no disability) to 8 (extremely severe disability), with higher levels indicating greater disability severity.
In this study, individuals with a CMS level of 2 or higher were considered to have disabilities, in accordance with the eligibility criteria under Taiwan’s Long-Term Care 2.0 program [32]. Therefore, the disability group was defined as older adults enrolled in the Long-Term Care Database (LTCD) who had a CMS level equal to or greater than 2.
Importantly, CMS assessments were more comprehensive than relying solely on ADL or IADL scores, as they incorporated multiple functional and clinical domains. The CMS score not only reflected the overall disability status but also determined the corresponding financial subsidies and types of services provided to eligible individuals. Supplementary Material Table S1 presented the possible ADL/IADL scores, associated service categories, and subsidy amounts corresponding to each CMS level.
Disease-Based predictive variables
Disability prediction features were derived from age, gender, and 123 disease conditions related to disability in the study group, with extensive disease details provided in Supplementary Material Table S2. The number of medical records pertaining to these disability-associated diseases over the three years preceding the disability onset was computed. A disease was confirmed for inclusion in the study if it had been recorded three or more times.
These 123 disease conditions related to disability were categorized into 23 groups: hypertension, diabetes, bone disease, visual impairment, cerebrovascular disease, transient ischemic attack, coronary artery disease, atrial fibrillation/other arrhythmias, cancer, respiratory, digestive, and genitourinary system diseases, dementia, mental illness, autism, intellectual disability, cerebral palsy, Parkinson’s disease, spinal cord injury, motor neuron disease, infectious diseases, rare diseases, and intractable epilepsy. These categories served as variables for developing the disability risk prediction model in this study.
Nowcasting-Based index date design for Real-Time disability risk assessment
The definition of an appropriate index date was fundamental in predictive modeling, as it served as the temporal anchor for feature extraction and outcome forecasting. An accurately specified index date ensured temporal validity, minimized information leakage, and reflected how prediction models would have been implemented in real-world clinical or administrative settings.
In this study, the index date was operationalized to simulate the point at which healthcare professionals or long-term care administrators evaluated an individual’s health status to assess disability risk. For participants who subsequently developed disability, the index date was defined as the date of disability diagnosis. For participants who remained free of disability, a random date within their observation period was assigned as the index date, conditional on the availability of at least three years of preceding health records and no prior disability events. Features were extracted from the three-year period preceding the index date (i.e., day − 1095 to day − 1) for all individuals. This approach ensured consistency in feature construction across cases and non-cases, captured temporally appropriate disease history, and maintained methodological rigor. A schematic overview of the feature construction process and index date definition was provided in Supplementary Material Figure S1.
This study adopted a nowcasting-based design, in which the model was tasked with estimating whether an individual was currently experiencing, or imminently approaching, disability status as of the index date, using only information available prior to that date. This is distinct from traditional long-term prognostic models, which aim to predict outcomes occurring within a future time frame (e.g., 6 or 12 months ahead). In contrast, nowcasting focuses on real-time risk detection and actionable prediction, making it particularly suitable for policy applications that require high-frequency surveillance and rapid identification of high-risk groups.
Our modeling strategy was designed to support batch prediction on any given calendar day, using only pre-index historical data, while avoiding any post-index leakage. In practical deployment, the model can be used to generate updated risk scores and high-risk lists at regular intervals, enabling timely outreach, functional assessment, or care resource reallocation by government agencies.
Feature selection
This study adopted an embedded feature selection method to refine the accuracy of machine learning models in handling high-dimensional datasets [33,34,35]. Tree-based machine learning algorithms calculated the Gini or entropy value of each feature, evaluating its informational contribution. Features were then ranked based on the accumulated Gini or entropy values, with a threshold set at 1.25 times the average. Features that surpassed this threshold were retained as predictors, while those falling below were excluded, ensuring that only features with significant predictive power were utilized.
In this study, tree-based algorithms (Decision Tree, Random Forest, XGBoost, and LightGBM) were utilized for feature selection, creating a hierarchy of features based on their weights. To gauge the efficacy of these feature selection models, five distinct machine learning algorithms were applied to the chosen predictor sets. The predictive performance of these sets was assessed by calculating the AUC after executing each algorithm ten times. The features identified by the embedded methods were detailed in Supplementary Material Table S3. The analysis revealed that the feature set selected by LightGBM, comprising 36 features, Surpassed the other sets in performance. Although a comprehensive feature set containing all 125 predictors achieved the highest AUC, the LightGBM feature set (FSM-LightGBM) demonstrated comparable AUC efficacy with only 36 predictors.
However, this study considered not only the number of selected features but also the overall predictive performance and stability across different machine learning models. As illustrated in Fig. 2, while FSM-XGBoost (25 variables) achieved similar AUCs, FSM-LightGBM (36 variables) demonstrated slightly higher and more stable performance across models including XGBoost, Random Forest, LightGBM, and Logistic Regression. Given our aim to construct a robust and generalizable disability prediction model, we selected the FSM-LightGBM feature set for further development, as illustrated in the heatmap presented in Fig. 2.

Heatmap of the AUC of selected-feature sets selected by embedded feature selection models. The y-axis represents the machine learning models (XGBoost, Random Forest, LightGBM, Logistic Regression, Decision Tree) utilized to validate the predictive performance of feature sets selected by various feature selection approaches. The x-axis represents the embedded feature selection approaches that use four tree-based machine learning models, namely XGBoost, Random Forest, LightGBM, Regression, and Decision Tree, for feature selection. The number of features selected by each embedded model is displayed. The values within each heatmap cell represent the AUC obtained by each machine learning predictive model using the corresponding selected feature set. The AUC values were calculated based on the training sets. For example, the AUC obtained by LightGBM using the FSM-Random Forest feature set (31 variables) is 0.855. And darker blue color indicates higher AUC
Machine learning algorithms
This study employed multiple supervised machine learning (ML) algorithms, including Logistic Regression, Decision Tree, XGBoost, Random Forest, and LightGBM, to classify and predict disability among elderly adults. These ML algorithms generated interpretable predictors that facilitated the understanding of the decision-making process, resulting in ML models [36, 37]. The interpretable predictors selected by the ML algorithms could be leveraged to develop prevention strategies for disability. All ML models in this study were trained and validated using R version 4.3.0.
Dealing with imbalanced data
The study yielded a disability outcome rate of approximately 10%, indicating an imbalanced data scenario that could diminish the effectiveness of the disability risk prediction model in classification and prediction tasks. The literature suggested the use of oversampling and undersampling techniques to address such data imbalances [38,39,40]. Nevertheless, empirical evidence indicated that in cases of high-dimensional data with ample samples, undersampling could outperform oversampling in terms of predictive accuracy [41, 42].
Given the magnitude of the dataset in this study, with 433,623 minority class instances and 125 predictive variables, a random undersampling approach was utilized. This technique involved randomly selecting a Subset from the group of elderly adults without disabilities to match the size of the group with disabilities, thereby balancing the ratio of individuals with and without disabilities and enhancing the predictive capacity without risking overfitting. Moreover, a 1:1 ratio was employed for the undersampling to maximize the model’s predictive performance.
Model validation
To evaluate the performance of the disability risk prediction model, this study adopted the 5-fold cross-validation approach. This method randomly divided the data into five equal folds, with four folds used for model training and one fold used for validation. This process was repeated five times so that each fold was used once as the validation set. The resulting performance metrics were averaged to assess the model’s robustness and its generalization ability to new data, thereby preventing overfitting and providing accurate performance estimates [43].
link